A price per square foot home value figure is the quickest sanity check a seller can run, and also one of the easiest ways to talk yourself into the wrong list price, because a single tidy number hides almost everything that makes one house worth more or less than the one next door.
You have probably seen the pattern. A neighbor mentions that a house down the street sold for a certain dollar amount per square foot, a website prints a neighborhood average, or a buyer’s agent casually multiplies your floor area by a figure and announces what your home “should” bring. It sounds objective. It is arithmetic, after all. But arithmetic is only as good as the inputs, and in housing the inputs are messy: whose measurement counted, which sales were included, what condition each home was in, and what the buyers of that particular month were willing to pay.
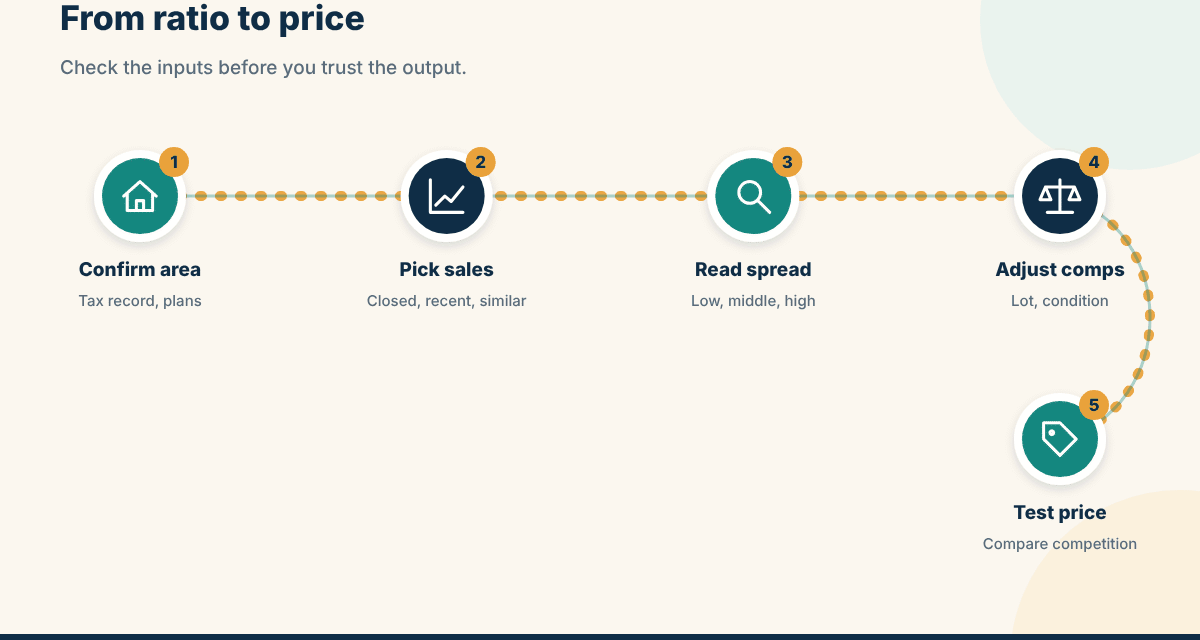
This guide treats price per square foot as what it really is, a screening tool. Used carefully, a price per square foot home value comparison tells you whether your early expectations are in a believable range and helps you spot a pricing opinion that does not add up. Used carelessly, it pushes you toward a number that ignores the lot, the layout, the roof, the school boundary and the season. We will walk through how the figure is built, where it breaks, and how to turn it into a decision.
Along the way we connect to the rest of our pricing library, including the cornerstone guide on how to price a house to sell. Nothing here predicts what your home will sell for, and no rule of thumb replaces current local sales data. Think of this article as a way to ask sharper questions of the numbers people hand you.
Key takeaways
- Price per square foot is a price per square foot home value ratio, not a valuation. It divides one number by another, and both can be wrong or inconsistent between homes.
- Square footage is not a fact you can take for granted. Appraisers, tax records, builders and listing sheets often measure differently, and basements, garages and additions are treated differently from place to place.
- A price per square foot home value check needs a clean sample. Recent closed sales of similar homes nearby beat asking prices, county-wide averages and old data.
- Look at the spread, not the average. A wide range of results is a signal that condition, lot and layout matter more than size.
- Smaller and larger homes rarely price in a straight line. The price per square foot home value figure often drifts as size changes, so compare like with like.
- Use the figure to test a price, never to set one. Adjusted comparable sales and, when needed, a professional opinion carry the real weight.
What a price per square foot home value figure actually measures
Before you lean on any figure, it helps to see exactly what produced it. The calculation is simple, but each half of the fraction has its own story, and sellers who skip that story tend to be surprised later by an appraisal, a buyer’s counter or an agent who values the home differently.
The arithmetic behind the number, and the measurement problem inside it
The formula is a sale price divided by the finished living area. If a home sold for an illustrative $400,000 and has 2,000 square feet, the result is $200 per square foot. That is the whole calculation. Every complication comes from deciding what counts as the sale price and what counts as living area.
Evidence to gather: which square footage you are dividing by
Start with the area figure for your own home, because you will compare it against other people’s figures. Several sources exist, and they do not always agree. The county assessor or tax record often reflects what a measurer or a past permit recorded. A builder’s plans show the designed area. A previous appraisal reports the area the appraiser measured, usually following a published measuring standard for finished, above-grade space. A listing sheet may repeat any of these, or an owner’s estimate.
Pull every document you can find: the tax record, any old appraisal, the original plans if you have them, and the listing history of your property. Note the differences. A gap of even a few percent matters when you multiply by a price per square foot home value figure, since a small change in the denominator shifts the result and, if someone is working backward from a target, shifts the implied value.
Pay special attention to what is included. Finished basements, converted garages, enclosed porches and attic rooms are the usual troublemakers. Many local markets treat below-grade space differently from above-grade space, and some multiple listing services have their own rules about what may be reported as living area. We cannot tell you your local rule here, so ask your listing professional or check the MLS rules for your area, and confirm how comparable homes reported theirs.
If you cannot find a trustworthy area figure, consider paying for a measurement. A licensed appraiser or a professional measurer can produce a floor plan and a total that follows a published standard. Fees and availability vary by region, so ask for a quote before you commit, and decide whether the cost makes sense given the value at stake and the number of buyers who may question the figure.
Whatever you decide, write the final number down and use it consistently. A listing that says one area while the tax record says another invites questions from buyers, appraisers and lenders. Discrepancies are not always a problem, but explaining them early is much easier than defending them during an appraisal or a negotiation, when a price per square foot home value argument can quickly become personal.
A scenario and your next step: the same house, two different numbers
Imagine a three-bedroom home with a finished basement. The tax record shows 1,800 square feet. The agent’s listing history for a similar house lists 2,400 because the basement was added in. Both houses sold for the same illustrative $450,000. One looks like $250 per square foot, the other like $188. Neither number is wrong, but they are not talking about the same thing.
This is the most common way price per square foot home value comparisons go sideways. Someone quotes a neighborhood figure without saying whether it counts the lower level, and you end up comparing your above-grade area against somebody else’s total. The result can look like a bargain or an overpriced listing when nothing of the kind is true.
Your next step is easy and free. Whenever someone gives you a price per square foot home value figure, ask which area was used and whether finished basement space was included. If the answer is vague, treat the number as a rough hint and move on to the actual comparable sales.
There is a quieter lesson inside this example. The number people quote at a dinner table or in an online comment is almost never accompanied by its definition. Once you start asking for the definition, you will find that most casual per-foot claims cannot survive a second question, and that is a healthy discovery rather than a frustrating one, because it keeps you from anchoring on a figure that was never comparable to begin with.
Anchoring deserves a word. The first number you hear tends to stick, even when you later learn it was shaky. If a relative tells you that homes nearby bring a certain amount per foot, every later opinion gets measured against it. Writing your own comparison, with your own sources, protects you from carrying around someone else’s number as though it were a fact about your house.
The data that makes a per-foot figure worth using
Once you trust the area, the second half of the work is the sample. A per-foot figure is an average of something, and an average of the wrong things is worse than no average at all.
Evidence to gather: closed sales, dates and property types
The strongest inputs are closed sales, meaning transactions that actually recorded a price, not asking prices that buyers never agreed to. Asking prices describe seller hopes. Sold prices describe what a buyer and a seller signed, which is why pricing professionals favor them. You can usually obtain recent closed sales through a listing professional, and public records in many places show recorded sale prices, though the detail varies by state.
Next, filter by time. Markets move, and a sale from a different season or a different interest-rate climate can mislead. Many professionals prefer sales from the most recent months, extending the window only when there are too few. There is no universal cutoff, and a slow rural area needs a longer lookback than a busy suburb.
Finally, filter by property type and location. Single-family homes, townhomes, condominiums and manufactured homes behave differently, and so do neighboring subdivisions with different school assignments, flood exposure or homeowner association fees. A tidy price per square foot home value sample comes from homes that a buyer would genuinely consider as alternatives to yours, not from everything that happened to sell in the zip code.
A practical way to build the sample is to start small and loosen it only when needed. Begin with homes that match your property type, sit within a short distance, share a school or subdivision pattern if that matters locally, and sold recently. Count them. If you have a handful of good matches, stop. If you have none, relax one filter at a time, and record which filter you relaxed so you remember how far your sample has drifted from your actual home.
Notes matter more than most sellers expect. Beside each sale, jot down anything you know about its condition, its terms, and why it did or did not sell quickly. Concessions, seller-paid credits and unusual financing can change the story behind a recorded price. A professional can often fill these gaps from the listing history, which is another reason to ask for the full file instead of just the average.
An exception and your next step: when the sample is too thin
Sometimes there simply is not enough data. A one-of-a-kind house, a rural property, or a small condominium building with a handful of sales per year can leave you with two or three comparables. When the sample is that small, one unusual sale, such as an estate sale, a distressed sale or a sale between relatives, can drag the average badly.
In that situation, do not average. Read each sale individually, find out why it sold at its price, and treat the price per square foot home value figure for each as a separate data point rather than a trend. If the sample is truly sparse, widening the geography or the time window is a trade-off: you gain data but lose similarity.
Our guide on how to adjust comps for home value goes deeper on the next step. For now, the practical advice is to be honest with yourself about sample size, and to admit when a price per square foot home value shortcut is giving you false comfort.
Finally, keep an eye on pending and active listings, even though they are not sales. Pending homes show what buyers are agreeing to right now, before the sale records. Active listings show the competition you will face and how other sellers are pricing relative to their size. Neither belongs in your average, but both help you judge whether recent closed sales still describe today’s conditions, which is the question a good price per square foot home value check should always include.
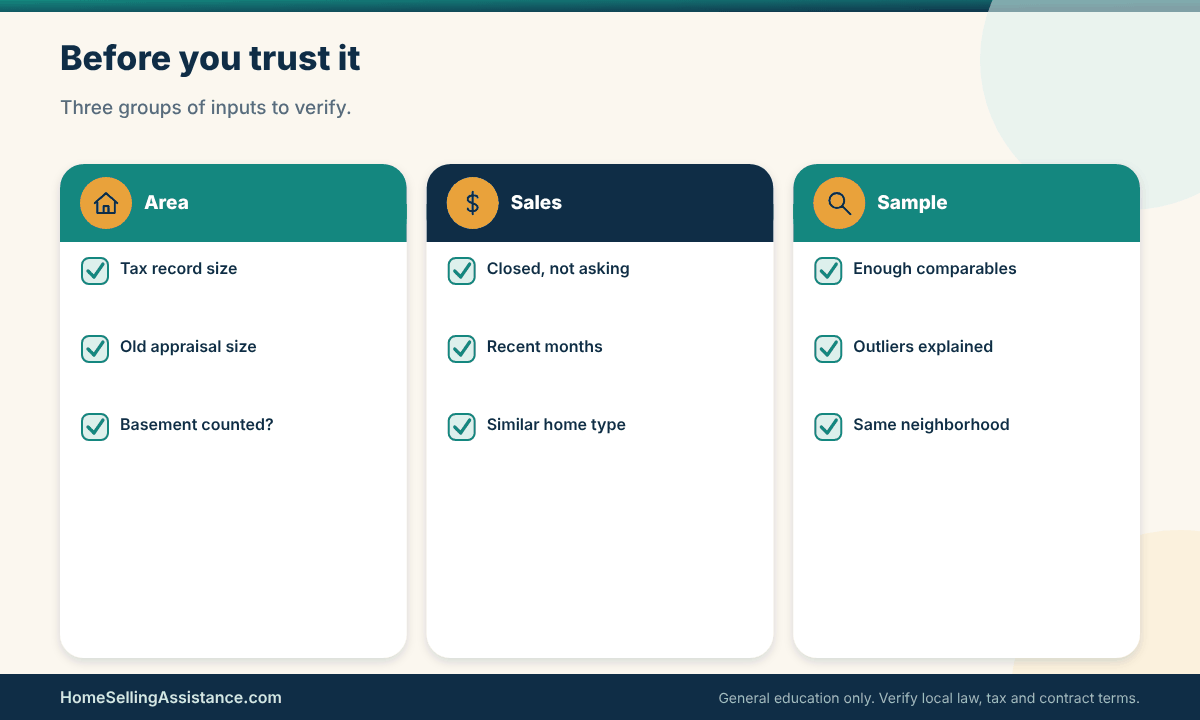
To keep the inputs straight, the checklist below pulls together what to confirm about the area, the sales and the sample before you trust any per-foot figure.
Separating signal from false precision in price per square foot home value math
A number with a dollar sign and two decimal places looks authoritative. That is exactly the danger. A price per square foot home value estimate feels precise, yet it rests on rounded measurements, uneven samples and a market that changes monthly. The goal of this section is to sort out what the figure can honestly tell you from what it only pretends to tell you.
What the evidence can honestly show
Used with discipline, a price per square foot home value comparison can do three useful jobs: flag a price that is wildly out of line, show how your home sits relative to nearby sales, and give you a plain way to question someone else’s opinion. It cannot do the work of a full pricing analysis.
Evidence to gather: a spread, not a single average
When you collect sales, resist the urge to compute one average and stop. Write down each sale’s per-foot figure, then look at the lowest, the highest and the middle. If five similar homes sold between, say, an illustrative $190 and $215 per square foot, that tight cluster tells you something: buyers in that pocket are valuing homes in a consistent way, and your home probably belongs somewhere in that neighborhood of results.
If the same five homes ran from $150 to $260, the price per square foot home value shortcut has told you something different. The market is paying very different amounts for homes that look alike on paper, which usually means condition, lot, layout, age of major systems or location within the neighborhood explains the gap. In that case, a single average is not just imprecise, it is misleading.
Also note whether the middle and the average disagree. When one extreme sale pulls the average away from the middle, the middle is generally the safer guide. This is basic descriptive statistics, not a secret, and a listing professional can show you the same thing in a few minutes if you ask for the individual sales behind the figure.
The table below organizes the most common claims you will hear, what each supports, and where each falls short. Use it as a quick translator when someone throws a number at you.
| Claim you may hear | Metric or source | What it supports | Limitation | Seller implication |
|---|---|---|---|---|
| “Homes here go for a set price per foot” | Neighborhood average of closed sales | A rough starting range | Ignores condition, lot and layout | Use as a screen, then compare individual sales |
| “Your home is worth its size times the going rate” | Area multiplied by one figure | A quick plausibility check | Assumes value rises in a straight line with size | Treat as a ceiling or floor test, not a price |
| “A nearby house sold for more per foot” | One recent sale | One data point | May have unique features or terms | Ask what made that sale different |
| “Per-foot prices are rising in this area” | Trend across months of sales | Direction of the local market | Mix of homes sold can change the average | Check same-type homes over time |
| “Listings in your zip code ask this much per foot” | Active listing prices | Competition you will face | Asking prices are not sale prices | Use to see competitors, not to value |
| “The county record says your home is this size” | Assessor or tax data | A baseline for area | May be outdated or measured differently | Verify against plans or an appraisal |
Read the table from left to right as you hear a claim. Name the source, ask what it really supports, notice the limitation, and only then decide how much weight to give it. Most sellers find that the claims they hear most often are the ones with the narrowest honest meaning.
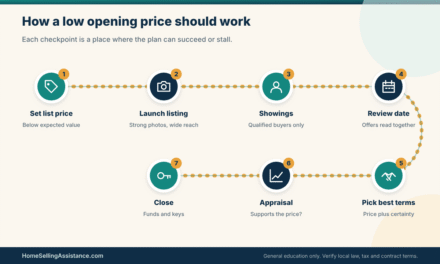
One more habit helps. Look at how long each comparable took to sell and how its final price compared with its first asking price. A home that sold quickly at its asking price may have been priced a little low, while one that lingered and dropped may show where buyers drew the line. The price per square foot home value figure on the closed sale alone hides that story, and the story tells you a lot about how forgiving the market will be of your first guess.
Be careful not to over-read a single quick sale. Multiple offers can push a price above the neighborhood pattern, and a slow sale may reflect condition or marketing, not value. Look for patterns across several sales, and treat outliers as questions, not as conclusions. A price per square foot home value range earns trust only when several independent data points agree.
A scenario and your next step: using the range as a sanity check
Picture a seller whose agent proposes a list price that works out to a much higher per-foot figure than any recent sale nearby. The seller does not know whether to trust the number. A price per square foot home value comparison is exactly the right tool here, not to overrule the agent, but to open a conversation.
The seller can ask: which sales support this figure, what did those homes have that mine does not, and what would a buyer see in my house that justifies being above the cluster? Perhaps there is a good answer, such as a recent kitchen renovation, a larger lot or a view. Perhaps there is not.
Either way, you have turned a vague feeling into a specific, answerable question. That is the proper job of the shortcut. It does not tell you the right price. It tells you where to look harder, and it can surface a pricing opinion that was built on optimism, on the wish to win a listing, or on a different set of homes than you assumed. Our guide on overpricing a house to sell explains why the cost of that mistake is often larger than sellers expect.
It also helps to separate precision from accuracy. A figure carried out to the penny feels precise, but if the area measurement is off by a few percent and the sample is thin, the real uncertainty is far wider than the decimals suggest. Honest pricing talks use ranges, because ranges communicate uncertainty. Be wary of anyone who gives you a single exact value without showing the spread and the assumptions underneath it.
That does not mean you should distrust every professional. Many give a single recommended list price because you need one to put on the listing. The point is simply that the recommendation should rest on a range of supported outcomes, with a clear explanation for where inside that range your home should sit and why a buyer would agree.
Property and neighborhood confounders that bend the math
A confounder is anything other than size that changes the price. In housing there are many, and most of them do not scale with square footage at all.
Evidence to gather: lot, layout, condition and finishes
Start with the land. Two homes of identical floor area can sit on very different lots, and in many markets the land carries a large share of the total value. A home on a quiet cul-de-sac with a deep yard is a different product from the same floor plan beside a busy road. Square footage says nothing about that.
Then consider layout and function. A well-planned 1,800-square-foot home with usable bedrooms can feel larger and sell better than a 2,200-square-foot house with awkward circulation, a dated floor plan or a bedroom that opens through another bedroom. The count of bedrooms and bathrooms often influences buyers as much as the total area, and per-foot averages do not capture that.
Finally, condition and finishes. Age and condition of the roof, the heating and cooling system, the windows and the kitchen change what a buyer will pay, and they change it in dollar amounts that are largely independent of size. A sensible way to document yours is to collect receipts, permits and dates for major updates. They give you something concrete to point to when you argue why your home should sit above or below the middle of a range.
Neighborhood boundaries are another quiet confounder. Two streets a few blocks apart can sit in different school zones, flood maps or tax districts, and buyers respond to those lines. An average that blends both streets will describe neither well. Ask where the sample was drawn, and if the answer is a whole zip code or an entire city, assume the figure is too blunt for a pricing decision on a single house.
Season and timing deserve the same suspicion. Sales that closed in a hot spring can look very different from sales in a quiet winter, and mortgage rate changes can shift buyer budgets within weeks. Our cornerstone on the best time to sell a house explains why local timing matters, and why a figure taken from the wrong season can mislead a price per square foot home value check.
An exception and your next step: the small house and the big house
One of the most reliable quirks of price per square foot home value math is that it rarely stays flat as size changes. Smaller homes in an area often show a higher per-foot figure than larger ones, because certain costs, such as the kitchen, bathrooms and land, are spread over fewer square feet. In some markets the pattern runs the other way, with large luxury homes commanding a premium. Which direction applies depends on the local market and cannot be assumed.
If your home is noticeably smaller or larger than the typical homes in your sample, a neighborhood average will be biased against you or in your favor. A 1,200-square-foot home compared against an average built mostly from 2,200-square-foot homes can look underpriced or overpriced for reasons that have nothing to do with its quality.
The next step is to narrow the sample to homes of similar size, ideally within a modest band of your floor area. When too few remain, accept that a price per square foot home value figure is the wrong shortcut for your property and move on to adjusted comparable sales. We cover the trade-offs between these approaches in our piece on a CMA versus an appraisal.
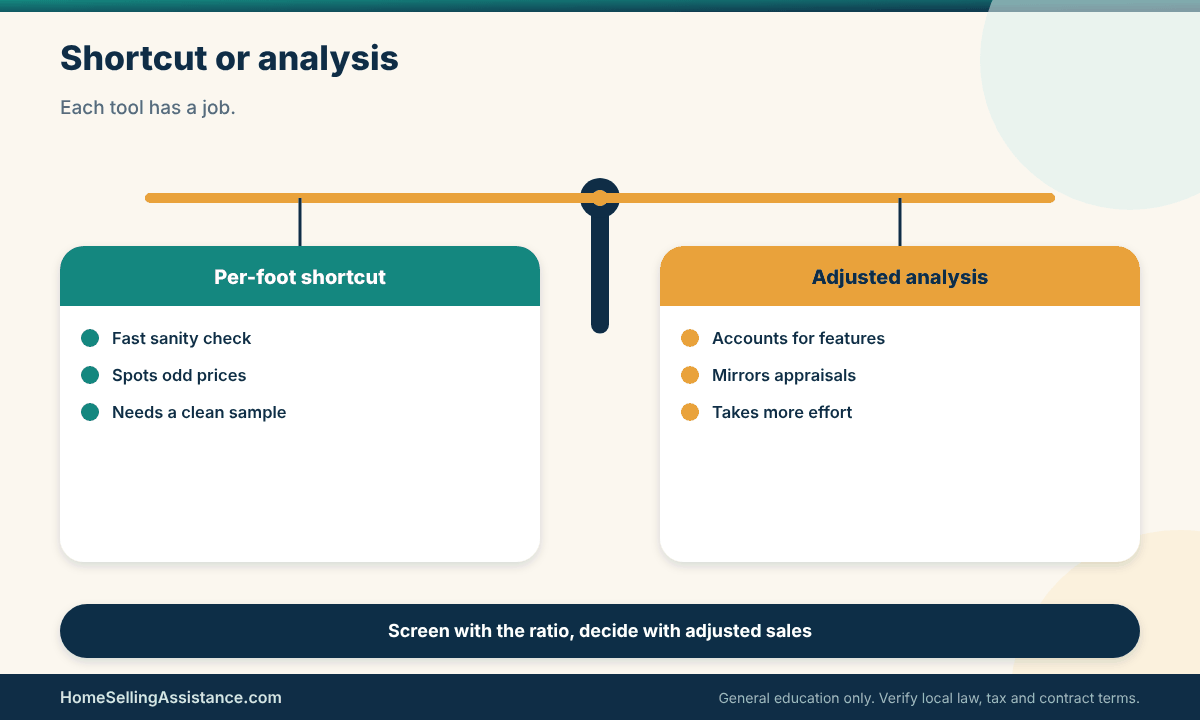
Taken together, these confounders explain why experienced professionals use price per square foot home value figures sparingly. They are comfortable with the price per square foot home value ratio as a conversation starter and as a cross-check against their adjusted analysis. They are uncomfortable when it becomes the only support for a price. If you notice that pattern in a pricing proposal you have received, you have found the moment to ask for the individual sales and the adjustments behind them.
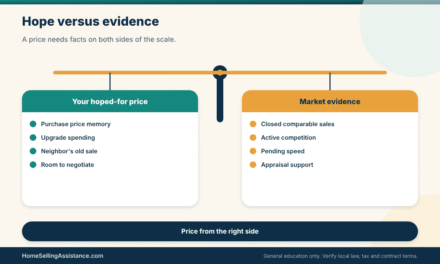
The scale graphic below sums up how the shortcut weighs against the fuller approach, so you can see at a glance when each one earns its place.
Translating a price per square foot home value into a seller decision
Evidence is only useful if it changes what you do. This last main section moves from understanding the metric to using it: where it fits in a pricing conversation, how to test a list price against it, and when you should stop relying on it altogether.
What the figure means for your list price
The honest answer is that it narrows the question without answering it. A per-foot check can tell you that a proposed price is believable or implausible. Choosing the exact list price still depends on adjusted comparable sales, your goals and the timing of your sale. For a broader frame, our explanation of list price versus market value versus appraised value separates three ideas that sellers constantly blur together.
Evidence to gather: adjusted comps beside the raw figures
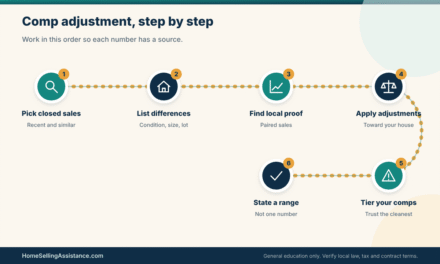
The strongest practice is to put two columns side by side. In one, list the raw price per square foot home value results from your sample. In the other, list the adjusted sale prices of each comparable, after accounting for differences such as an extra bathroom, a larger lot, a finished basement or a recent roof. Adjustments are dollar amounts, and professionals estimate them from paired sales, cost data and market feel.
If the two columns point to roughly the same range, you have convergent evidence, and your confidence can reasonably rise. If they diverge, the adjusted figures deserve more trust, because they have already accounted for the differences the raw ratio ignores. A gap between the two is not a failure. It is information about how much your property differs from the typical home that sold.
Keep in mind that a buyer’s lender may order an appraisal, and an appraiser will use adjusted sales, not a price per square foot home value average. That means a price built mostly on a price per square foot home value ratio can run into trouble later. You can read how value opinions differ in how much is my house worth, which compares the main ways to estimate it.
The sensitivity table below shows how common assumptions about your home and market can push a price per square foot home value comparison in either direction, and what to verify before you accept it.
| Assumption | Expected effect on the per-foot figure | Confounder | What to verify locally |
|---|---|---|---|
| Your home is smaller than the sample | Often a higher per-foot figure | Fixed costs spread over less area | Compare only homes in a similar size band |
| Your home is larger than the sample | Often lower, sometimes higher in luxury tiers | Diminishing or premium returns by size | Check how larger homes actually sold nearby |
| Finished basement included in area | Lowers the figure if counted in full | Below-grade space valued differently | Ask how each comp reported its area |
| Recent renovation or new roof | Can raise the figure | Quality and permits vary widely | Gather receipts and see if comps had similar work |
| Market is changing quickly | Older sales misstate today’s level | Interest rates and seasonality | Weight the most recent months and pending sales |
| Busy road, odd lot or flood zone | Can lower the figure | Location factors not tied to size | Compare homes with a similar setting |
| Condo or HOA community | Fees and amenities distort comparisons | Monthly dues and special assessments | Compare within the same building or complex |
Use the table as a checklist before you accept any price per square foot home value comparison. Find the row that matches your property, read across, and confirm the local detail named in the final column with someone who sees current sales every week.
When you compare columns, resist averaging the adjusted prices into one number too quickly. Look first at which comparables needed the largest adjustments, because large adjustments carry the most uncertainty. A sale that needed only small corrections is a stronger anchor than one that required thousands of dollars of guesses. Weighting the cleanest comparables more heavily is standard practice, and you can ask your professional which ones they trusted most and why.
It is also worth asking how the adjustments were estimated. Some come from paired sales, where two nearly identical homes differ by one feature. Others come from cost estimates or experience. A thoughtful explanation lends credibility, while a vague answer suggests the adjustments may be little more than a gut feeling. A price per square foot home value comparison that survives this questioning is far more useful than one that does not.
A scenario and your next step: testing a price before you commit
Suppose a seller wants to list at a price that equals a recent neighbor’s per-foot sale figure. The neighbor’s house was larger, newly renovated and sold in a competitive stretch. The seller’s home is smaller, with original finishes. A straight per-foot match would likely overstate the value, because the better home set the benchmark.
The seller can test the price in three simple ways. First, check the adjusted comparison: what adjustments would a buyer apply for the renovation and the size difference? Second, look at the competing active listings and ask how the proposed price stacks up against homes a buyer could tour the same weekend. Third, discuss a plan for early feedback, including what you would do if showings are light, which our guide to home price reduction strategy addresses.
None of that guarantees a result. It does mean your first price is a reasoned estimate with a plan attached, not a number lifted from a neighbor’s sale.
Think about how you will respond to feedback once the home is listed. Early showings, online views and offers are real-time evidence, and they can confirm or challenge your pricing logic within the first couple of weeks. Decide in advance what level of activity would make you comfortable and what would prompt a conversation about adjusting. Deciding ahead of time keeps emotion from steering you after a quiet weekend.
Also think about your own situation. If you need to close by a certain date, a price slightly below the top of the range may suit you better than a hopeful number, while a seller with no deadline can afford to test the higher end. Neither strategy is correct for everyone. What matters is that the choice is deliberate, which our guide on underpricing strategy examines from the other side.
Quick scenario
Two sellers on the same street hear the same neighborhood figure of an illustrative $210 per square foot. One has a 1,500-square-foot home with updated systems and a deep yard. The other has a 2,400-square-foot home with a dated kitchen. Multiplying out gives the first seller a number that may undersell the home and the second a number that may oversell it. The same ratio, applied without adjustment, pushes them in opposite directions.
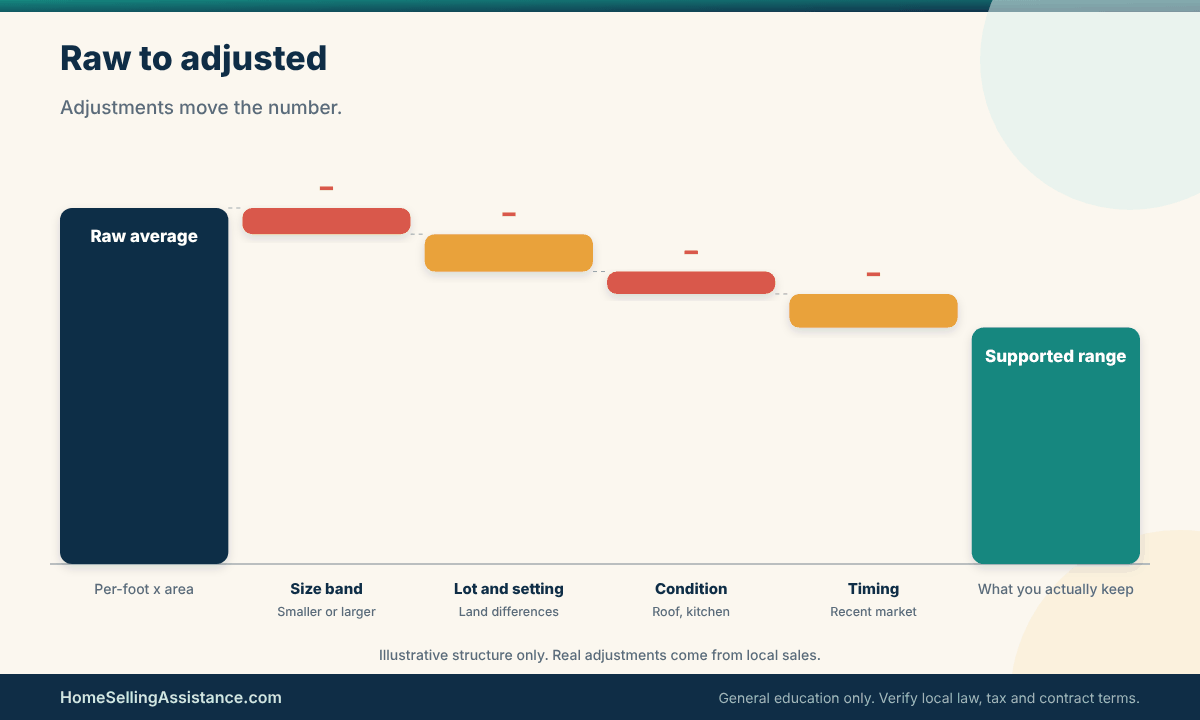
Offers bring one more use for the ratio. When a buyer proposes a price, converting it into a price per square foot home value figure can help you see how it compares with recent sales and with your own expectations. It is a convenient lens, not a verdict. Terms such as closing costs, repairs, financing type and possession date change the real value of any offer, so weigh the whole package before you respond, not just the headline number or its per-foot equivalent.
What still requires local pricing or professional analysis
There is a point where the price per square foot home value shortcut stops being useful and a full analysis starts. Knowing where that line sits protects you from both overconfidence and unnecessary spending.
Evidence to gather: appraisal, CMA and agent analysis
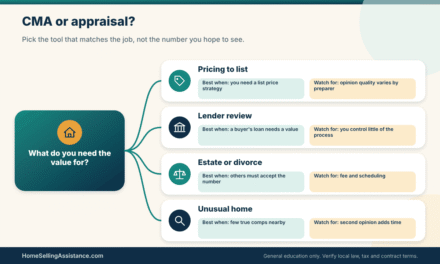
Several professional products exist. A comparative market analysis, often prepared by a real estate licensee, uses recent comparable sales and current competition to suggest a price range. An appraisal, prepared by a licensed or certified appraiser, is a formal opinion of value typically ordered by a lender or by an owner who wants a stand-alone document. Some owners order a pre-listing appraisal. Whether that is worthwhile depends on the home and market, as our article on whether a pre-listing appraisal is worth it explains.
Ask any professional to show you the individual comparables behind their conclusion and how they adjusted each one. A trustworthy analysis can explain the logic in plain terms. If the explanation reduces to a price per square foot home value average and a confident tone, ask for more.
Be careful with automated valuation estimates and neighborhood averages shown on websites. They can be useful as a starting point, but they typically cannot see your updates, your lot quirks or your condition. National data from groups such as the National Association of Realtors gives helpful context about the broader market, though national figures are not a forecast for your street.
Also remember fair housing principles when you discuss neighborhoods. Pricing opinions must rest on property and market facts, not on who lives nearby, and the HUD fair housing resources explain what is off limits when homes are described or marketed.
Another useful distinction is between the opinion of value and the strategy for marketing. A professional may believe a home is worth a certain amount yet recommend listing slightly higher or lower for strategic reasons, such as leaving room to negotiate or attracting more early attention. A price per square foot home value comparison speaks to the first question only. The second is about how buyers search, how competing listings look, and how much negotiation room you want.
Ask your professional to separate the two clearly. You should hear, in plain words, what the home is likely worth in the current market based on the evidence, and then what pricing approach they recommend and why. If those get tangled together, you may end up mistaking a marketing choice for a valuation, and a price per square foot home value shortcut will not untangle them.
An exception and your next step: unusual homes that defy the shortcut
Some properties are simply poor candidates for a price per square foot home value approach. Homes with large acreage, a guest house, significant water frontage, a historic designation, a unique architectural style, or a mixed-use layout often have value that is not driven by floor area. A 900-square-foot cabin on a spectacular lot can be worth more than a 2,500-square-foot house in a plain subdivision.
Condominiums add another wrinkle, since monthly dues, reserves and building condition can override unit size. For specialty properties like these, ask a professional with direct experience in the property type, and ask how many similar sales they have actually seen.
Then choose how much help you need. A short pricing conversation may be enough for a typical house. A written valuation may be sensible if the property is unusual, if heirs or co-owners need documentation, or if the stakes are high. Staging and repairs also shift value, so read what repairs to make before selling a house and our staging guide before you finalize.
Documentation is the quiet hero of a sound pricing decision. Keep a simple folder with your area figures, the comparable sales you reviewed, notes on condition, receipts for improvements and any professional opinions you received. It helps you stay consistent, supports conversations with buyers and appraisers, and, if heirs, co-owners or a spouse need to understand how a price was chosen, it gives everyone the same facts to work from.
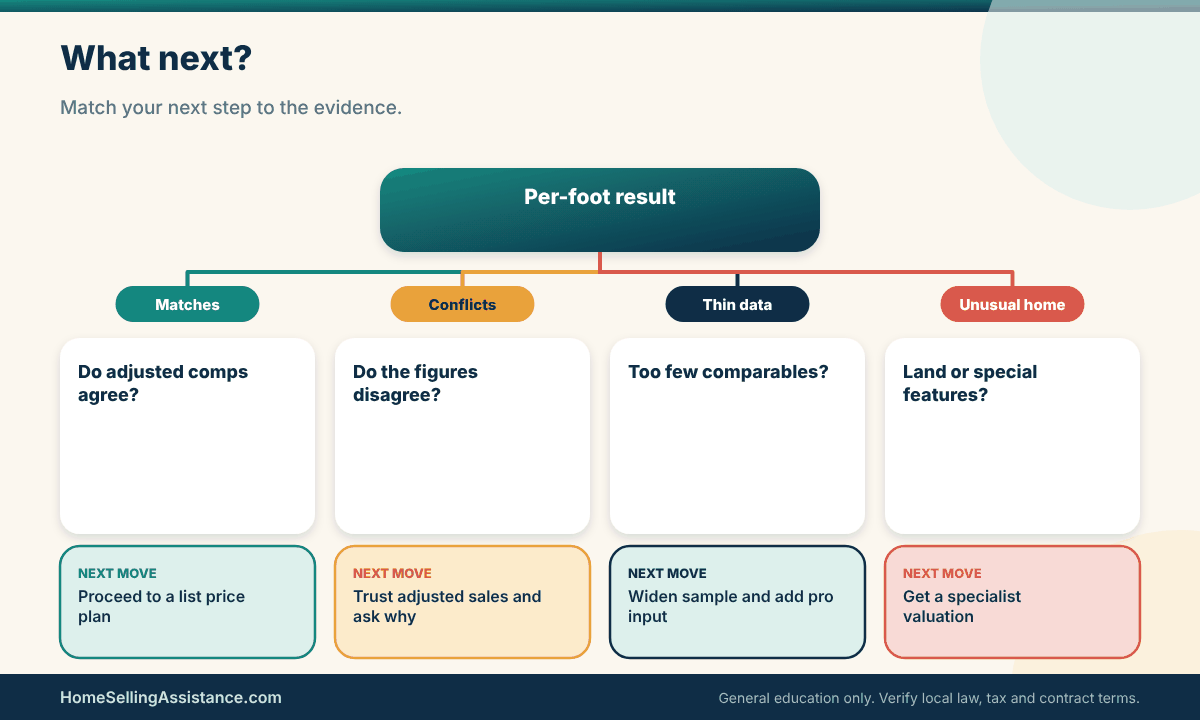
The decision tree below shows how to move from a price per square foot home value result to a next step, depending on what the evidence says.
Frequently asked questions about price per square foot home value
Is price per square foot a reliable way to value my home?
It is reliable as a rough screen and unreliable as a final answer. A price per square foot home value estimate works best when the sample is recent, nearby and made of similar homes. It stops working when your property differs in lot, condition, layout or size from the homes behind the average. Treat it as a first pass, then rely on adjusted comparable sales for the actual price.
How do I calculate price per square foot for my own house?
Divide a sale price by the finished living area. To check your own home, you would use a realistic expected price and your measured area, then compare the result with recent closed sales of similar homes. The tricky part is the area, so confirm which figure your tax record, any old appraisal and local comparable sales used before you compare anything.
Does finished basement space count in square footage?
It depends on local practice and on the rules of the multiple listing service. Many appraisal approaches report above-grade living area separately from finished below-grade space, and many markets value them differently. Because rules vary, ask your listing professional how comparable homes reported their area and compare like with like.
Why do smaller homes often show a higher price per square foot?
Some costs, such as kitchens, bathrooms, mechanical systems and land, do not shrink in proportion to floor area. Spreading them over fewer square feet can raise the per-foot figure. The pattern is common but not universal, and some luxury markets show the opposite, so check how homes of different sizes actually sold in your area.
Should I use asking prices or sold prices?
Sold prices give a better picture of what buyers actually paid. Asking prices show what sellers hoped for and what competition looks like, which is useful for strategy but not for valuation. When you review a price per square foot home value comparison, make sure it is built on closed sales, and note how asking prices compare so you understand your competition.
Can an online estimate replace a pricing analysis?
Online estimates can be a starting point, and some are close in some places. They usually cannot see renovations, condition, the quality of your lot or recent sales that have not yet recorded. Use them to frame questions, not to set a price. A written analysis from a licensed professional that shows individual comparables is a stronger basis for a decision.
Will an appraiser use price per square foot?
Appraisers commonly adjust for size differences and may note per-foot figures as a supporting check, but the core of an appraisal is a comparison of adjusted sales. If your list price rests mainly on a ratio, a lender’s appraisal may land differently. That is one reason to build your price on adjusted comparables and review our guide on pricing and home value.
How much do repairs and updates change the per-foot picture?
They can matter a great deal, but the effect is specific to the home and the market, and no universal percentage applies. A recent roof or kitchen may help your home compete against others, while dated systems may call for a lower price or a credit. Gather receipts and decide with local guidance whether repairs make sense, and see our guide to evaluating an offer for how repair requests appear in negotiations.
Does a higher per-foot price mean more money in my pocket?
Not necessarily. What you keep depends on your mortgage payoff, fees, credits, prorations and any taxes. A higher sale price helps only if it actually closes, and an overpriced listing can sit and end up selling for less after reductions. Our overview of seller closing costs shows what comes out of a sale price before it becomes proceeds.
When should I hire a professional instead of relying on the shortcut?
Consider help when your home is unusual, when the sample is thin, when numbers from different sources conflict, or when the stakes are high. A professional can explain adjustments, local demand and timing. Choose someone who shows their work. Laws, licensing and customs vary by state, so check with your state real estate commission or an attorney about what a pricing professional can and cannot do.
The short version
A price per square foot home value figure is a handy flashlight and a poor map. It shows you whether a price sounds believable, and it should lead you to better questions about area, sales, condition and local demand. Before you set a list price, compare adjusted sales, check what professionals can show you, and keep the cornerstone guide on pricing a house to sell close at hand. This article is general education, not legal, tax or financial advice, so confirm details with qualified local professionals.