Housing inventory impact sellers in a very direct way, because the number of comparable homes that buyers can choose from decides how much attention your listing gets, how firmly you can hold your price, and how long you may wait for a signed contract.
Most sellers meet the word “inventory” in a headline. A news story says supply is tight, or that listings are piling up, and suddenly everyone at the dinner table has an opinion about whether this is a good moment to sell. The headline is usually about a whole country or a whole metro area. Your house, though, sits on one street, in one school zone, at one price point, and it competes only with the handful of homes a buyer would realistically put on the same shortlist.
That gap between the headline and your driveway is what this guide is about. Put simply, housing inventory impact sellers only once it is measured against the right group of competing homes. We will define the terms in plain language, show which numbers are worth pulling and which are decoration, and explain why housing inventory impact sellers feel can be dramatic in one neighborhood and nearly invisible in the next. We will also be honest about what inventory data cannot tell you, because a clean chart can create a false sense of precision.
This article supports our broader guide on the best time to sell a house. If you want the big picture first, start there and come back. If you already know the basics and you are staring at a stack of listing statistics, keep reading. Nothing here is a forecast or a promise about price, and nothing replaces a current comparable-sales review for your own address.
Key takeaways
- Inventory is a count of competition, not a verdict on your price. Housing inventory impact sellers differently depending on price band, property type and location, so a metro-wide number is only a starting clue.
- Look at the homes a buyer would actually compare with yours. A tight shortlist of true competitors tells you more than any national chart.
- Inventory moves together with demand. Few listings can still feel slow if few buyers are active, and many listings can still feel brisk if buyers are plentiful.
- Treat every statistic as a range, not a point. Small samples, seasonal swings and unusual listings can distort what looks like a clear signal.
- Use inventory to shape your plan, not to guess a sale price. It should inform pricing strategy, showing readiness and patience, while current local comparable sales and professional analysis still set the number.
What housing inventory impact sellers actually means in plain terms
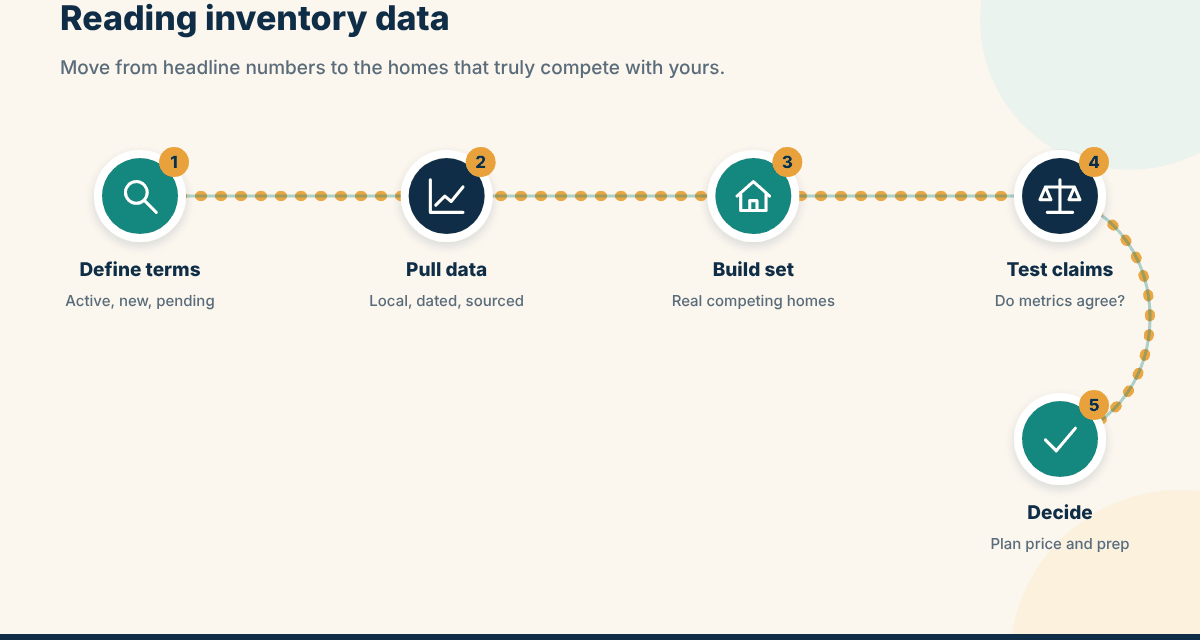
Before any strategy, it helps to agree on vocabulary. Inventory, supply, active listings, new listings and months of supply are used loosely in conversation and more carefully in market reports. If you mix them up, you can read a perfectly accurate report and still draw the wrong conclusion about your own sale.
This section defines the measures that matter, explains where the figures come from, and shows how to narrow a broad statistic down to the competition that really touches your listing. Think of it as learning to read the dashboard before you decide how fast to drive.

The inventory numbers sellers keep hearing about
Three or four measures appear again and again in market commentary. Each answers a slightly different question, and none of them answers the question you care about most, which is how many serious alternatives a buyer has to your home right now.
Evidence to gather: active listings, new listings, and pace of sales
Active inventory is the count of homes currently listed and available for sale in a defined area. It is a snapshot. New listings measure how many homes hit the market during a period, such as a week or a month, so they describe the flow of fresh competition rather than the stock sitting around. Pending or under-contract counts show how many homes have buyers already attached.
Months of supply connects stock to pace. The idea is simple: if current active listings were divided by the recent monthly rate of sales, the result estimates how many months it would take to sell everything on the market at that pace, assuming no new listings arrived. Different data providers define the sales pace slightly differently, so two reports can show different figures for the same town.
Many reports describe a low months-of-supply reading as leaning toward sellers and a high reading as leaning toward buyers. The dividing line varies by area, by price band and by how a given provider calculates it. Treat any single threshold you see quoted online as a rule of thumb, not a law. The honest way to use it is by comparison: how does your area look today against its own recent months and the same period in earlier years?
Where do you find figures on housing inventory impact sellers can trust? The best source is a current report built from your local multiple listing service, which a licensed agent or a broker can often share. Regional Realtor associations publish monthly summaries. National trade groups such as the National Association of Realtors publish national and regional existing-home data with dates attached. Always note the date and the geography, because an inventory figure without either is hard to interpret.
One practical habit helps a lot. Write down three things whenever you copy a statistic: what area it covers, what time period it measures, and who produced it. A number that cannot be traced to a source and a date should not influence a decision that involves hundreds of thousands of dollars.
A scenario, an exception, and your next step for reading the headline
Here is an illustrative example of housing inventory impact sellers might misread, using made-up round numbers. Suppose a regional report says active listings in your county rose compared with the same month last year, and the headline calls it a buyer-friendly shift. You read further and find the increase came mostly from new townhome construction in one corner of the county, priced well above your home.
For you, the headline overstates the change. Your competition is older single-family homes in a narrower price band, and that group may not have grown at all. The exception works in the other direction too. A headline that says supply remains tight may hide a pocket of your price band where several similar homes just listed within a week of each other.
The next step is to translate the headline into a question you can test. Ask which part of the market grew or shrank, whether it overlaps with your property type and price range, and whether the change is recent or has been building for months. A seller who can say “supply in my band is up a little, mostly in homes that need updating” is already thinking more clearly than most.
If you are working with an agent, bring this question to the listing conversation. A thoughtful professional should be able to show the competing homes by address, not just a chart. If you are selling on your own, you can collect much of the same picture from public listing sites, though you will need to verify status and dates yourself. Our guide to a seller’s market versus a buyer’s market explains how to interpret these labels without letting them hijack your plan.
Data that would back up a claim about your street
Sellers sometimes ask whether housing inventory impact sellers more in spring or in winter, in big metros or in small towns. The honest answer is that the effect changes with the setting, so a rule learned in one place rarely transfers neatly to another. What transfers is the method: define the competition, gather dated evidence, and compare.
Suppose someone tells you that housing inventory impact sellers by handing them a pricing edge whenever supply is low. That might be true. It might also be a sales line. The way to find out is to ask what data would back the claim, and then to look at that data yourself, or ask to see it.
Evidence to gather: the competing-listing set
The most useful evidence is a list, not a chart. Build a short list of homes that a buyer for your property would plausibly consider: similar size, similar age or style, a comparable price band, the same general commuting or school area, and a similar level of condition. Include what is currently active, what is pending, and what sold recently.
For each home, record the list price, any price changes, the date it listed, the date it went under contract if known, and the final sale price if it closed. Note obvious differences, such as a renovated kitchen, a busy road, a larger lot or a finished basement. This is more work than reading a monthly report, but it is the single most informative exercise a seller can do.
Why does the list beat the report? Because a summary of housing inventory impact sellers averages away the exact thing you need to see. If four homes in your band are active and two of them have been sitting for months with price cuts, that tells you something about buyer appetite at those price points. A county average would blur it into a single number.
Keep a separate note about what is missing from the data on housing inventory impact sellers rely on. Off-market or pocket deals, new construction not yet listed, and homes that quietly withdrew can all influence what buyers do, and they rarely show up neatly in public data. You cannot fix that gap, but you can remember that the list is incomplete and treat your conclusions with a bit of humility.
If you plan to hire an agent, ask for this competing-set analysis during the interview. It is a fair test of local knowledge, and it lets you compare how different professionals think. Our piece on days on market for sellers goes deeper on how to read the time stamps in that list.
Scenario: when the competing set is very small
Imagine, for illustration, that your home is a three-bedroom ranch in a small neighborhood, and in the last year only three similar homes sold. That is a thin sample. Two of them closed under unusual circumstances, one as an estate sale needing repairs and one with a buyer who paid extra for a quick possession date.
With so few data points, any inventory statistic is shaky. A single new listing could swing a ratio dramatically, and a single unusual sale could distort the picture of what buyers will pay. Thin markets reward caution rather than certainty, and any claim about housing inventory impact sellers in a thin market deserves extra scrutiny. Widen the geography a little, extend the time window, and say plainly in your notes that you stretched the search.
The exception is a market where scarcity is real and visible: a handful of buyers touring every new listing, multiple showings booked within hours, and offers arriving quickly. Even then, scarcity is a condition, not a promise. Your next step is to talk with a licensed local professional about how housing inventory impact sellers in your position and how your home fits the small set, and to ask what price range they would defend using specific comparable homes.
If instead you find a surprisingly crowded set, do not panic. Crowded does not mean hopeless, because housing inventory impact sellers by raising the bar, not by closing the door. It means your home needs to stand out on price, condition or presentation, which is exactly what the later sections discuss. A broader view of how long sellers typically wait, and why, appears in our guide on what to do when a house is not selling.
Separating real signal from false precision in inventory reports
A tidy line chart invites trust. It shows a number going up or down, it has a date range, and it looks like science. Yet housing inventory impact sellers through a tangle of causes, and a chart rarely shows the tangle. The practical skill is to ask what a given piece of evidence can support, and what it merely suggests.
This section does two jobs. First, it lays out what inventory evidence can legitimately show a seller. Second, it walks through the local and property-specific factors that bend the story, so that you can spot them before they cost you time or money. A claim and evidence matrix follows later to tie the ideas together.
What housing inventory impact sellers can and cannot show
Let us be fair to the data on housing inventory impact sellers first. Inventory figures are genuinely useful. They are just narrower than people assume. Used well, they describe conditions around you. Used badly, they turn into a prediction nobody can actually make.
Evidence to gather: trends, comparisons and context
What evidence about housing inventory impact sellers can show is direction and relative position. If the count of active homes in your price band has risen over several months while the pace of sales has stayed flat, buyers probably have more choice than they did before. If new listings have thinned out while showings stay steady, there is likely less competition for each buyer’s attention. Direction is the safe reading of housing inventory impact sellers data.
It can also show how your area compares with itself. Setting this spring beside last spring, or this month beside the prior three, is often more revealing than comparing your town with a faraway city. Seasonality matters here, so read our explainer on home selling seasonality before you blame a normal seasonal swing on a market shift.
Inventory evidence can show where competition clusters. A report broken out by price band or property type might reveal that supply is generous in larger, higher-priced homes and scarce in smaller, entry-level ones. That is the kind of detail that makes housing inventory impact sellers unevenly, and it is why a broad average can mislead in both directions.
Finally, it can show how long homes like yours are taking relative to what is listed. Days on market, price reductions and the ratio of final sale price to original list price are all pieces of the same story. None of them is a promise, but together they give a feel for how buyers are reacting to asking prices.
What it cannot show is your result. No dataset knows how your kitchen photographs, how your agent prices, whether a relocating buyer happens to need your exact school district, or whether a rate change next month shifts the pool of buyers who can afford you. Housing inventory impact sellers alongside demand, so our guide to how mortgage rates affect home sellers covers one of the biggest demand-side forces that inventory figures alone do not capture.
A scenario, an exception, and your next step for reading trends
Picture this housing inventory impact sellers scenario, with illustrative numbers. In your neighborhood, active listings have gone from a few homes to a few more across two months. A friend says that means prices are about to drop. A more careful reading asks what else changed. Perhaps those extra listings are mostly spring arrivals, and perhaps sales pace picked up at the same time.
The exception is a real shift. If supply rises, sales slow, and price cuts become common across several months in a row, the combined picture does point toward more negotiating room for buyers. One metric moving is a hint. Several metrics about housing inventory impact sellers moving together, in a consistent direction, over a reasonable stretch of time, is a signal.
Your next step, whenever you study housing inventory impact sellers, is to write down which pieces of evidence agree and which disagree. If they conflict, say so out loud and do not resolve the conflict by choosing the metric you prefer. A seller who admits “the data is mixed” will price and prepare more flexibly than one who picks a story and defends it.
The following matrix gathers the claims you are most likely to hear, along with the evidence that could support each one and the limits you should keep in mind. Use it as a quick filter whenever an article, a neighbor or a sales pitch makes a confident statement about the market.
| Claim you hear | Metric or source | What it supports | Limitation | Seller implication |
|---|---|---|---|---|
| “Supply is tight, so list high” | Active listings and months of supply, local MLS | Fewer alternatives for buyers in the area | Says nothing about buyer demand or your price band | Check competing homes before choosing a list price |
| “Listings are piling up” | New listings versus pending sales, dated report | Competition may be rising | Seasonal arrivals can mimic a shift | Compare with the same period last year |
| “Homes sell in days here” | Median days on market, recent closed sales | Typical speed for sold homes | Median hides overpriced listings that never sold | Look at unsold and withdrawn homes too |
| “Buyers have the upper hand” | Price reductions and sale-to-list ratio | More negotiation on asking prices | Averages blend very different homes | Prepare for offers below asking, plan your floor |
| “The national trend applies to us” | NAR or Zillow national data, dated | Broad context only | National figures are not a local forecast | Use as background, not as a price guide |
| “Only three homes compete with yours” | Hand-built competing set | Your actual shortlist rivals | Small samples swing wildly | Widen search and say so when you decide |
Read this matrix of housing inventory impact sellers claims from left to right as a chain. A claim needs a metric. A metric supports something specific and nothing more. Every metric has a limitation, and the limitation turns into a practical step for you. If you cannot fill in the last column honestly, you probably do not yet have enough evidence to act on the claim.
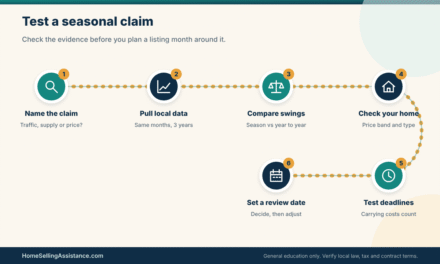
The illustration above lays out the order we find most useful when sorting evidence: define the claim, pull the data, test it against your competing set, and only then decide what to change. Sellers who skip the middle steps tend to react to headlines, which usually produces either an overpriced first week or a panicked price cut.
Local and property-specific confounders that bend the story
Think of a confounder as a second cause hiding behind the first. If you notice slow showings and blame supply, you may be overlooking a tired kitchen, a high list price or a rainy weekend. Sorting out housing inventory impact sellers feel from everything else going on is the hardest part of reading a market, and it is why professionals talk in ranges rather than certainties.
A confounder is anything that changes the outcome besides the factor you are studying. In housing, confounders are everywhere. Housing inventory impact sellers in a particular home sale through a filter made of the property, the street and the timing, and sometimes the filter matters more than the inventory number itself.
Evidence to gather: property condition, price band and location quirks
Start with your home’s own characteristics, because they filter whatever housing inventory impact sellers might otherwise expect. Condition, layout, lot, parking, noise, outdoor space and the presence of an obvious flaw all affect how a buyer sees you relative to the competition. A well-presented home in a crowded market can outperform a tired one in a scarce market, because buyers are sorting, not just scanning.
Price band is a second filter. Supply is rarely spread evenly. An entry-level price point might see a flood of interested buyers and almost no listings, while homes in the next price tier might have plenty of choices and slower traffic. Your own band is the one that matters, and reports that blend the entire county will not show it.
Location quirks are the third filter. A school boundary, a flood-zone designation, a rail line, an HOA with strict rules or a planned construction project can change who your buyers are. Our guide on selling a house as is touches on how condition and disclosure interact with buyer expectations, which becomes even more important when buyers have many alternatives.
Other quirks are quieter. A listing with an unusual floor plan may have a long wait that has nothing to do with supply. A home with a short lease on an accessory unit, a pending special assessment in a condo association or an unpermitted addition may bring buyers down in price regardless of how few other homes are listed. Local rules and customs vary, so confirm what applies with your state real estate commission, a title company or a local attorney.
A scenario, an exception, and your next step for local confounders
Imagine two nearly identical homes on the same street, both listed in a month with low overall supply. One has fresh paint, clean photographs and clear disclosure paperwork ready. The other has dated finishes, dim photos and a visible roof repair that nobody has explained. Same inventory number, very different buyer reactions.
The exception shows up when location overwhelms everything. A home next to a noisy highway may sit regardless of tight supply, because a certain share of buyers simply will not consider it. In that case the right response is usually a price and expectation adjustment, not waiting for more demand to appear.
Your next step is to list your three biggest property-specific advantages and your three biggest drawbacks, written as a buyer would see them. Be a little harsh. Then compare that list with the homes in your competing set. If your drawbacks outnumber theirs, plan for a more conservative price or targeted preparation, and be careful about assuming that low supply will carry you.
The sensitivity table below helps you stress-test your assumptions. It shows how a change in a market or property assumption might shift the expected effect, what confounder could muddy the result, and what you should verify locally before relying on it. The effects are directional and qualitative on purpose, since no honest table can print a universal percentage.
| Market or property assumption | Expected effect | Confounder | What to verify locally |
|---|---|---|---|
| Fewer competing listings in your price band | More attention per listing, possibly firmer pricing | Weak buyer demand or high borrowing costs | Showing counts and offer activity on recent comparable listings |
| More competing listings in your band | Buyers compare more; presentation and price matter more | Many may be overpriced and unlikely to sell | Which active homes have price cuts or long time listed |
| New construction opens nearby | Added choice for buyers who want newer homes | Different price band, amenities and incentives | Builder pricing, incentives and move-in dates |
| Your home has a notable flaw | Fewer qualified buyers, more negotiation | Disclosure and repair costs vary widely | Repair estimates and what comparable flawed homes sold for |
| Listing in a seasonal slow period | Fewer showings regardless of supply | Climate, school calendar and local custom | Same-period results in prior years from local reports |
| Rates shift during your listing | Buyer budgets and pace may change | Job news, local employers and consumer mood | Lender guidance and recent pending-sale activity |
Use the table as a conversation starter about housing inventory impact sellers with whoever is helping you price. For each assumption that applies to your sale, ask what evidence they have seen locally, and how recent it is. If an answer comes back as a generic percentage with no source, treat it as marketing rather than analysis.
Quick scenario
Illustrative only: a seller sees that active listings in the county are down and decides to list well above comparable sales. After several weeks with few showings, the seller reviews the competing set and notices that the three most similar homes were all priced lower and are already under contract. Low supply did not rescue a price that sat outside the buyers’ shortlist. The seller works with a local professional to reprice against current comparables and relists the home with better presentation.

Turning housing inventory impact sellers into a pricing and showing plan
Evidence is only useful if it changes what you do. Once you have a feel for the competition and for the limits of the data, the question becomes practical: how should the level of supply shape your price, your preparation, your showing schedule and your patience? This section answers that question about housing inventory impact sellers in general terms and flags what a licensed local professional must still decide with you.
Neither extreme works. Sellers who ignore supply entirely tend to be surprised. Sellers who obsess over it tend to over-correct. A sensible plan keeps housing inventory impact sellers face in perspective, as one input beside condition, price, timing and personal goals.
Practical moves when competition is thin or crowded
It helps to picture your own listing from a buyer’s seat. A buyer scrolling through listings does not think about inventory at all. They see a handful of homes that fit a budget, compare photos, price and location, and book a few tours. Housing inventory impact sellers by changing how many homes are in that handful and how forgiving buyers can afford to be about flaws.
When the handful is small, a buyer who likes your home may move quickly, because waiting risks losing it. When the handful is large, the same buyer can take more time, ask for repairs or credits, and walk away more easily. Neither situation is good or bad by itself. Each simply changes which seller habits pay off, and understanding how housing inventory impact sellers in each situation lets you choose your habits deliberately.
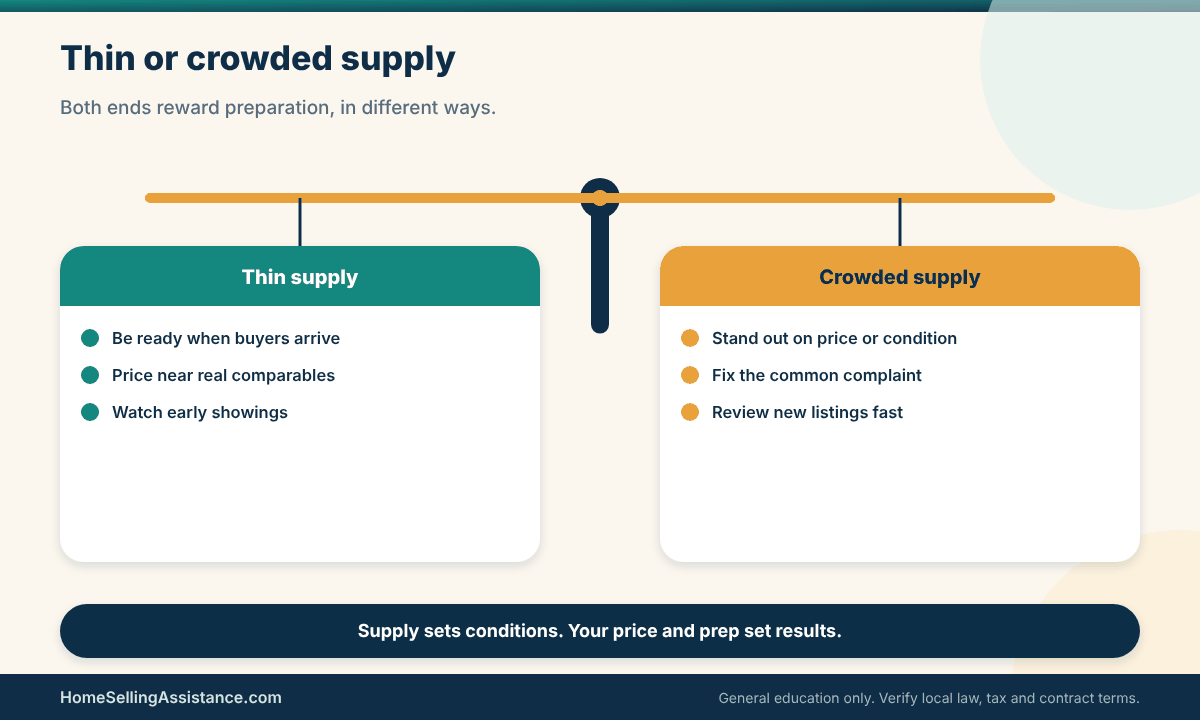
The two ends of the supply spectrum call for different habits, though both reward preparation. In a thin market, you want to be ready when interest arrives. In a crowded one, you want to make it easy for buyers to choose you over a similar alternative.
Evidence to gather: showing activity, feedback and offer patterns
The market’s reaction to your listing is itself evidence, and it arrives quickly. Track how many showings you get in the first week, what buyers or their agents say afterward, whether online interest such as saves and views is climbing, and whether any offers come in. Early activity is the most honest reading of how your price and presentation fit current supply.
Compare this with the activity on homes in your competing set. If similar homes drew a flurry of showings in the first few days and yours did not, supply is not the explanation. Price, photographs, description or condition probably is. If everything in the area feels quiet, the cause may be broader demand, and you have less room to blame your own choices.
In a thin-supply setting, be careful about a common mistake. Sellers hear that competition is low and assume a high price will be accepted. A bold list price can still work if the data supports it, but a price that scares off the first wave of buyers can waste your best weeks. Remember that the earliest days on market often bring the most attention, so an overreach has a cost. Our guides on when to reduce a house price and how much to reduce it explain how to adjust if the first weeks go quiet.
In a crowded setting, differentiation is the strategy. That might mean pricing at the level of the most attractive comparable home rather than the average, fixing the one issue buyers will mention in every showing, or making the home easier to tour. Flexible showing hours, a clean and uncluttered space, and complete paperwork ready for review can reduce friction without costing much.
Whatever housing inventory impact sellers see in the data, be aware that fair housing rules apply to every showing and every conversation. Your decisions about who may tour, how you describe the home and how you respond to offers must not steer or favor anyone on the basis of a protected class. The HUD fair housing resources explain the federal framework, and your state may add further protections.
A scenario, an exception, and your next step for adjusting the plan
Take an illustrative case of housing inventory impact sellers on a single listing. You list a two-story home in a neighborhood where only a couple of similar homes are available. In week one you receive a handful of showings and one low offer. In a thin market that might feel disappointing, but it also tells you buyers are real and sensitive to price.
A reasonable response is to look at the feedback, compare your price with the pending homes nearby, and decide whether the low offer deserves a counter. You are not obliged to accept anything, and you are also not obliged to ignore a serious buyer because you believed supply ensured a better deal. If the offer comes with a strong buyer and a fair path to closing, think about how your priorities weigh speed against price. Our guide on how to evaluate a home offer as a seller offers a structured way to compare terms beyond the headline number.
The exception is the market where competing listings flood in right after you list. If three similar homes appear in the same week at lower prices, your plan needs to change fast. Review the new listings the day they appear, and be willing to adjust presentation or price early rather than waiting for a month of silence to confirm what you could have seen sooner.
Your next step is to set review dates before you list. For example, decide in advance that you will review activity and the competing set after the first week, then again after a couple more. Writing the rule down protects you from emotional decisions and makes any conversation with an agent or an advisor easier.
If multiple buyers do show up at once, the situation changes again. Our article on handling multiple offers as a seller explains how to compare them without letting a single number dominate your decision. Use the broader reading on market conditions and timing to see how these articles connect.

Where you still need local pricing help and professional analysis
Sellers sometimes feel that asking for help means they have failed at research. It is the opposite. A thoughtful seller uses the research to ask sharper questions and to judge whether the answers hold up. Housing inventory impact sellers in ways that only local, current and property-specific analysis can describe with any confidence, and that analysis is worth paying attention to.
Consider also the people involved beyond price: your lender if you are buying next, your attorney or title company where one is customary, and a tax professional if you have a large gain or unusual ownership history. Each can answer questions an inventory report never will. Timing a sale around the market is only one thread. Your own financial and legal footing is the rest of the rope.
Even a careful seller reaches a point where a general guide is not enough. Knowing how housing inventory impact sellers helps you ask better questions, but a defensible list price comes from current comparable sales, an inspection of your actual home and, where relevant, advice that no general article can give.
Evidence to gather: comparable sales, condition review and professional opinions
The core pricing evidence is recent comparable sales, adjusted for real differences between those homes and yours. A licensed agent can prepare a comparative market analysis. A licensed appraiser can provide an independent valuation, which is a different product with a different purpose. Each has strengths, and neither is a promise of what a buyer will pay. See our piece on the broader pricing and home value topic for ways to cross-check numbers.
Ask any professional to explain how housing inventory impact sellers in your exact area shaped their opinion, and what comparable homes they used. A confident answer includes addresses, dates and honest caveats. A vague answer built on a percentage and a slogan should make you more cautious, not less.
Compensation is another area where you should rely on current, local, written information. Broker compensation practices have changed in recent years, and what is offered, negotiated and disclosed can differ by contract and by state. Compensation is negotiable and should be put in writing, so read any listing agreement carefully and ask questions before you sign.
For market context, dated national data can help you understand the climate, but it should sit behind local evidence. If you want a trusted reference for existing-home trends, consult published reports from the National Association of Realtors, and then ask a local professional how those trends compare with what they see on the ground.
A final category of evidence is documentation. Condition issues, permits, repairs, association rules and disclosure obligations all affect value and buyer confidence, and they vary by state. Gather what you have, ask your state real estate commission or a local attorney what you must disclose, and do not rely on generic advice for something that carries legal weight.
A scenario, an exception, and your next step for getting local help
Consider a seller who has built a competing set, studied the trends and still disagrees with an agent’s suggested price. This is a healthy moment, not a failure. Ask the agent to walk through each comparable, explain adjustments, and show which homes were most similar. If the disagreement remains, consider a second opinion, or an independent appraisal if you want a different kind of check.
The exception is when a unique feature makes comparables unreliable, such as a historic property, a large parcel, an unusual condo building or a home with a rental unit. In those cases, the usual inventory logic weakens, and professional analysis becomes even more valuable. Specialty properties often need an agent or appraiser with experience in that particular niche.
Your next step is to prepare a short list of questions about housing inventory impact sellers before you meet anyone: which homes are my true competitors, what has changed in the last few weeks, what would make you adjust the price, and what is your plan if the first two weeks are quiet? Having these ready keeps the conversation focused on evidence.
If your home has been listed for a while without success, step back and review the full picture. Our guide on what to do when a house is not selling walks through the usual suspects in a logical order. For help understanding the wider process around pricing, timing and paperwork, our cornerstone guide to how to sell a house maps the entire journey, and our overview of timing your sale ties the seasons and the market together.

Frequently asked questions about housing inventory impact sellers
What does housing inventory mean for someone about to sell?
It means the number of homes buyers can choose from at a given time and place. For you, the useful version is the set of homes that compete with yours on price, size, condition and location. Housing inventory impact sellers by shaping how much attention a listing gets, but the effect depends on demand as much as supply.
Does low inventory guarantee a higher sale price?
No. Few listings can help your home stand out, but buyers still compare price with value, and borrowing costs and local jobs still affect budgets. A price set above what comparable homes support can sit even when supply is thin. Treat low supply as a favorable condition that rewards good preparation, not as a promise.
How do I find inventory data for my own area?
Ask a licensed local agent or broker for a current report built from the local multiple listing service. Regional Realtor associations also publish monthly summaries, and national groups publish dated national data. Write down the geography, the time period and the source for every number you use, since an undated figure is hard to trust.
What is months of supply, and should I rely on it?
It is an estimate of how long current listings would take to sell at the recent pace of sales. It is a useful comparison tool, especially against your own area’s earlier months. The thresholds people quote for a seller-leaning or buyer-leaning market vary by place and by data provider, so avoid treating any single cutoff as a rule.
Is inventory the same everywhere in my city?
Almost never. Supply can be generous in one price band or neighborhood and scarce in another. This is why housing inventory impact sellers unevenly even within one town. A report for the whole city may hide the pocket that actually competes with your listing, so ask for the data broken down as finely as the sample allows.
Should I wait for inventory to drop before I list?
Waiting is a gamble in either direction, because supply can rise or fall for reasons nobody can predict. Your own situation usually matters more: your move date, your mortgage, your next home and your carrying costs. Compare the cost of waiting with the possible benefit, and discuss timing with a professional who knows your market. Our timing guide covers the trade-offs.
What if many similar homes list right after mine?
Review them quickly, because new competition changes the comparison buyers are making. Look at their prices, photos and condition, and ask whether your listing still stands out. If it does not, consider adjusting presentation or price early rather than waiting. A planned review date, set before you list, makes the decision less emotional.
Can an agent promise how inventory will affect my sale?
No honest professional can promise a price, a timeline or a buyer. They can show you the competing homes, explain recent patterns and describe sensible strategies. Be wary of anyone who offers a certain outcome or leans on a universal percentage. Ask for addresses, dates and written terms for anything that matters, and remember that compensation is negotiable.
Do national headlines about inventory apply to my home?
Only as background. National figures describe broad conditions and can differ sharply from your county or neighborhood. They are a reasonable way to understand the climate, but they are not a local pricing forecast. Use them to frame questions, then rely on current local comparable sales and your own competing set for decisions.
Who should I ask when the data conflicts?
Start with a licensed local agent or appraiser who can explain their reasoning with specific comparable homes. For legal or disclosure questions, consult your state real estate commission or a local attorney, and for tax questions consult a qualified tax professional. Housing inventory impact sellers differently from place to place, so local expertise matters more than any national rule.
A calm way to use inventory data
Housing inventory impact sellers most when you read it locally, in context and with humility. Gather a real competing set, watch early buyer activity, keep your review dates, and let a licensed professional help you turn evidence into a price. This article offers general education, not legal, tax or financial advice, and it cannot predict your sale. Rules and markets vary, so verify the details that matter with local professionals and official sources before you act.